These functions provide a shorthand for passing palette_lgbtq() to values parameter of an appropriate ggplot2
scale.
Arguments
- values
character(1)
Name of the flag the colors are based on.- ...
ANY
Arguments passed toggplot2::scale_color_manual().
Examples
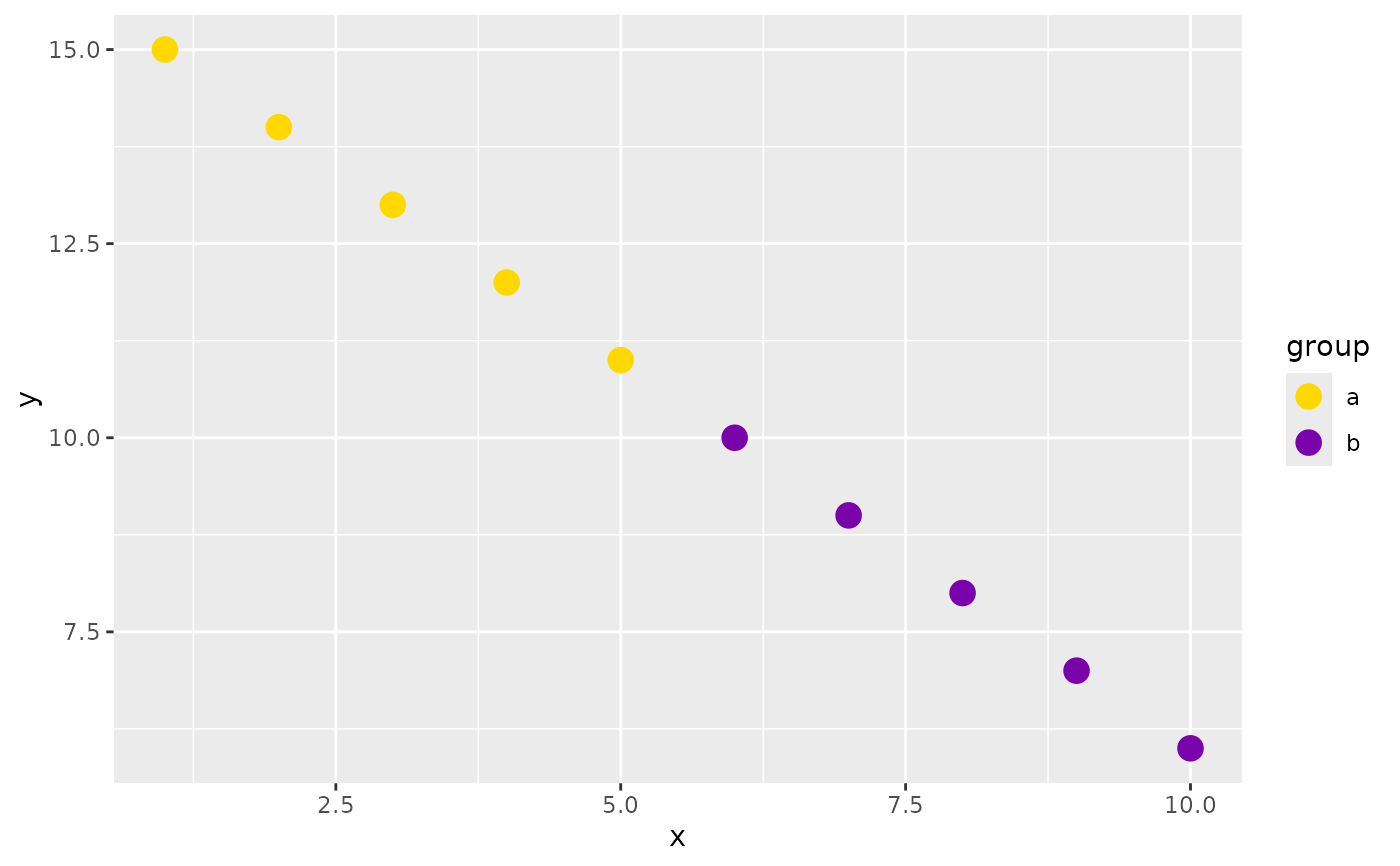
data <- data.frame(
  x = 1:10, y = 15:6,
  group = rep(c("a", "b"), each = 5)
)

# Instead of specifying scale_color_manual()
ggplot2::ggplot(data, ggplot2::aes(x = x, y = y, color = group)) +
  ggplot2::geom_point(size = 4) +
  ggplot2::scale_color_manual(values = palette_lgbtq("intersex"))


# One can use scale_color_lgbtq()
ggplot2::ggplot(data, ggplot2::aes(x = x, y = y, color = group)) +
  ggplot2::geom_point(size = 4) +
  scale_color_lgbtq("intersex")
# One can use scale_color_lgbtq()
ggplot2::ggplot(data, ggplot2::aes(x = x, y = y, color = group)) +
ggplot2::geom_point(size = 4) +
scale_color_lgbtq("intersex")